Open this article in your favourite assistant
Get an instant summary, or save it as a source your AI can cite later.
Two brands, similar order volumes, same Shiprocket integration, same Shopify setup, both selling into tier-2 cities on Meta ads. One runs 34% RTO on COD. The other runs 13%.
The difference is not that one has better ops. It is that one sells kurtas and the other sells serums.
Category mechanics drive RTO more than most brands realise. A fashion founder benchmarking against a beauty brand's RTO number will draw the wrong conclusions and implement the wrong fixes. A beauty founder benchmarking against electronics will underinvest in category-specific risks they actually face.
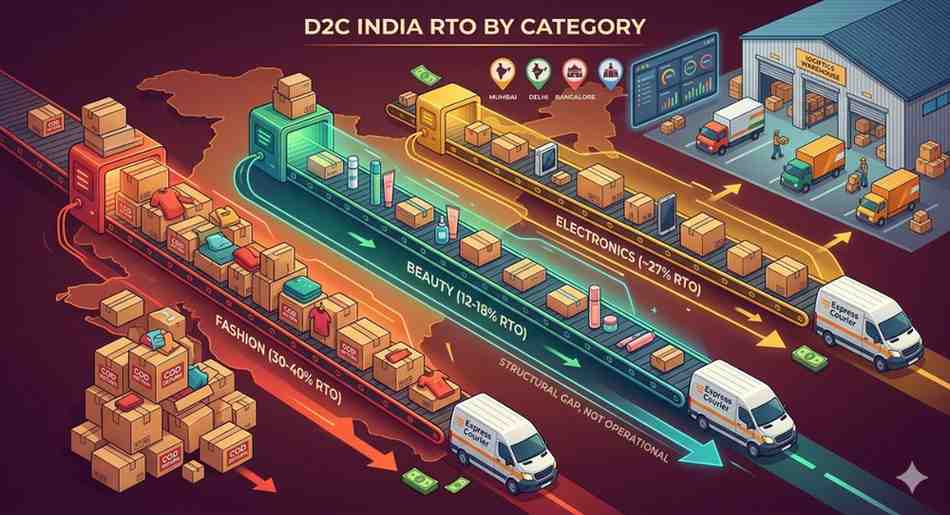
This post breaks down RTO rates across Indian D2C's main categories: fashion, beauty and personal care, electronics, footwear, jewellery, and health supplements. The numbers come from Unicommerce's India D2C Report 2026 (410 million-plus shipments across 6,000-plus brands), GoKwik's festive quarter data (August 2025), and publicly available courier intelligence. Where a figure is estimated rather than directly cited, it is marked [VERIFY].
The goal is not benchmarking for its own sake. It is helping you understand which category forces are working against you and which tactics will actually move your specific number.
What RTO Rate Actually Measures
RTO rate is the percentage of dispatched orders that come back to your warehouse without being delivered. It is not the same as returns: returns are buyer-initiated after successful delivery. RTO happens before delivery. The customer either refused the order, was unreachable, or had an address the courier could not find.
This distinction matters for category analysis. Fashion has a double problem: high RTO (failed delivery) and high voluntary returns (buyer remorse after delivery). Beauty and electronics mostly have the RTO problem. Jewellery has almost neither.
When industry reports quote "return rates" for Indian ecommerce, they often conflate the two. Fashion's 25-40% figure covers both. For operational purposes, separate them in your own tracking: RTO and voluntary returns require completely different interventions.
The other metric that matters alongside RTO rate is COD share. Because RTO is almost entirely a COD problem (prepaid RTO runs at 4-8% nationally; COD RTO runs at 28-35%), categories with high COD penetration will structurally have higher RTO. This is the single biggest variable that explains inter-category differences.
Fashion: The Hardest Category
Fashion COD RTO in India runs between 25% and 40% depending on sub-category. Brands selling occasion wear, ethnic festive collections, and fast-fashion-adjacent items sit at the higher end. Basics and daily wear come in lower. GoKwik's August 2025 data showed footwear (closely related to fashion in buyer psychology) at 27.9% RTO. Most apparel brands doing significant COD volume are somewhere in the 28-38% range.
Several forces stack against fashion specifically:
Fit uncertainty creates commitment-aversion
A customer looking at a kurta on Instagram cannot know if it fits. Indian sizing is not standardised across brands. The customer's most rational strategy under uncertainty is to order COD, try it when it arrives, and pay only if they like it. The courier interaction becomes a fitting room visit. If something feels off, refusing is free.
This is structurally different from how a serum customer behaves. The serum either has the ingredients they want or it doesn't. That is a binary check they can make before ordering, not after touching the product.
Social ad impulse cycle
Fashion is the dominant category in Indian D2C social advertising. A customer scrolling Reels at 10 PM, inspired by a lifestyle image, places a COD order. By the time Delhivery arrives four days later, the emotional trigger that drove the purchase is gone. Daylight and a courier call feel very different from late-night Instagram. Refusal rates spike for orders with long delivery windows on impulse fashion purchases.
High COD share persists
Fashion buyers are disproportionately COD-defaulting compared to electronics or beauty. Trust in brand is lower for new D2C labels. Product fit risk makes prepaid feel risky. Even as India's overall COD share fell below 50% for the first time in August 2025 (GoKwik), fashion categories remain well above that average. High COD share means high RTO exposure mechanically.
Damage on return
Fashion items that come back often come back damaged: tried on, tagged removed, packaging destroyed. The sellable inventory recovery rate for fashion RTO is lower than electronics or beauty. A returned kurta might be discounted 30-40% or liquidated. This raises the true cost of each RTO event well above the logistics line.
Fashion RTO reality check: A brand doing 2,000 COD orders/month at 32% RTO is processing 640 returns. At a true cost of ₹500 per RTO (shipping both legs, packaging, QC labor, 20% markdown on recovered inventory), that is ₹3.2 lakh bleeding out every month from RTO alone.
Beauty and Personal Care: Why It Performs Better
Beauty and personal care (BPC) COD RTO typically runs 10-18% for Indian D2C brands that have been operating more than 18 months. New brands launching without an established customer base see higher rates initially (20-25%) as they attract more exploratory, low-commitment buyers.
The category's structural advantage is prepaid penetration. GoKwik's festive quarter data (2025) showed BPC prepaid share climb from 38.7% to 55.5%, the largest shift of any major D2C category. That means more than half of BPC orders are not COD, removing them from the high-RTO pool entirely. Since prepaid RTO runs at 4-8% nationally, a BPC brand at 55% prepaid is effectively immunising more than half its order base from the worst-case scenario.
Why BPC buyers convert to prepaid more readily
Beauty purchases are driven by ingredient trust, not fit. A customer who has researched niacinamide serums on Reddit, seen a dermatologist recommendation, and decided to try a specific product is a committed buyer. They are not ordering COD to hedge against fit uncertainty. They know what they want and they pay upfront.
Additionally, BPC brands have built stronger repeat purchase cycles. Unicommerce's India D2C Report 2026 found Health and Pharma growing at 48% and BPC at 41% in FY26, outpacing fashion at 21%. Repeat buyers have established trust with the brand and are far less likely to refuse delivery or use COD as a no-commitment mechanism.
Where BPC still bleeds RTO
BPC has its own specific RTO triggers. Wrong shade ordered (foundations, lip colours, hair dyes) leads to refusal at delivery. Allergic reaction anxiety on new-to-customer formulations prompts COD hedging. And BPC sold on general marketplaces performs worse than BPC sold on brand-owned D2C stores: marketplace buyers have lower brand attachment and higher comparison-shopping behaviour.
For tier-2 and tier-3 expansion, BPC brands face the same address and reachability problems as everyone else. A skincare brand scaling from metros into smaller cities will see RTO climb until they build delivery intelligence for those markets.
Electronics: High Stakes, Lower Rate Than Fashion
Electronics RTO in India ran at approximately 27% in August 2025, down from 31.5% in the prior period (GoKwik). That improvement correlates with higher prepaid adoption: GoKwik's data showed electronics prepaid share at 64.1% during the festive quarter, the highest of any major D2C category. With nearly two-thirds of electronics orders already prepaid, the COD RTO problem is partially contained structurally.
Electronics still has a meaningful COD segment. Entry-level peripherals, phone accessories, and audio products below ₹1,500 attract COD buyers who are price-sensitive and often ordering from Tier-2 markets with limited prepaid habit. This cohort's RTO behaviour mirrors fashion: high refusal, address problems, and customer unreachability.
Why each RTO costs more in electronics
The per-RTO financial impact in electronics is much higher than fashion or beauty. Shipping a ₹2,999 bluetooth speaker both ways costs ₹200-300 in logistics. Add warehouse receiving, testing for damage (electronics require functional QC, not just visual inspection), repackaging, and the CAC on a paid ad customer: a single electronics RTO easily hits ₹800-1,200 in true cost. At 27% RTO on 500 monthly COD orders, that is ₹10-15 lakh in annual RTO loss from COD alone.
Tamper risk and open-box stigma
Electronics returned through RTO often have broken seals. Selling open-box electronics in India requires discounting to 70-80% of original price in most D2C contexts. Unlike apparel that can be re-tagged, or beauty that can be re-inspected, electronics with broken seals trigger immediate customer trust loss at resale. The inventory write-down per RTO is higher than the logistics cost in many cases.
Footwear, Jewellery, Supplements: The Rest of the Picture
Footwear
Footwear behaves like fashion in RTO terms. GoKwik's August 2025 data put footwear RTO at 27.9%. Size uncertainty drives COD preference: a customer ordering a ₹999 sandal in size 8 does not want to pay online if they're not certain the size chart translates correctly to their actual foot. Brands that offer size exchange policies and make them prominent at checkout see lower RTO because they shift the perceived risk from "I might get stuck with a wrong product" to "I can swap if it doesn't fit."
Jewellery
Jewellery is an outlier: return rates in the 3-5% range, some sources citing as low as 4% for established sellers with strong product imagery. The reasons are multiple. Jewellery purchases are deliberate and researched, not impulse. High-value jewellery is almost entirely prepaid: customers spending ₹10,000-plus on silver or gold-plated pieces do not typically opt for COD. And the product does not have fit uncertainty in the same way apparel does; a necklace either matches the product image or it doesn't, and this is apparent immediately.
Health supplements and nutraceuticals
Supplements typically run 12-18% COD RTO. The category has a health-committed buyer who has researched the product, high prepaid intent (supplement buyers are often routine-driven), and repeat purchase behaviour that builds trust quickly. The main RTO risk is first purchase by a new buyer who ordered impulsively on a health influencer recommendation and had second thoughts before delivery.
Why These Gaps Exist
Three variables explain most of the inter-category RTO difference:
1. COD penetration by category
This is the biggest driver. Prepaid orders return to origin at 4-8%. COD orders return at 28-35%. The category with the highest COD share will have the highest RTO regardless of how good the operations are. Fashion has the highest COD share among major D2C categories. Jewellery has the lowest. The correlation with RTO rates is almost linear.
2. Fit and sizing uncertainty
Categories where the buyer cannot assess product fit before receiving it (fashion, footwear) drive COD-as-fitting-room behaviour. Categories where the product specification is deterministic (supplements, electronics with clear specs) allow prepaid commitment. Beauty sits in between: some products (skincare) are deterministic, some (foundations, hair colour) are not.
3. Buyer intent quality at the moment of order
A customer who spent 20 minutes reading serum reviews before ordering has higher purchase intent than a customer who tapped an Instagram Reel and ordered a kurta in 90 seconds. The latter is more likely to refuse at delivery. Category advertising channels and funnel depth directly affect RTO because they shape the intent quality of the buyer arriving at checkout.
What Good Looks Like by Category
These are operational benchmarks for Indian D2C brands running more than 1,000 orders per month with a reasonable mix of COD and prepaid:
| Category | Typical COD RTO | World-class COD RTO | Key driver of gap |
|---|---|---|---|
| Fashion / Apparel | 28-38% | 16-20% | Size confidence, prepaid nudges, high-risk pincode routing |
| Footwear | 25-30% | 14-18% | Size exchange visibility, exchange-over-refund policy |
| Beauty and Personal Care | 12-20% | 7-11% | Shade/variant confidence tools, prepaid conversion rate |
| Electronics | 22-30% | 12-16% | COD limit by order value, OTP verification, buyer scoring |
| Health supplements | 12-18% | 6-10% | First-purchase COD scoring, subscription conversion |
| Jewellery | 4-8% | 2-4% | Prepaid default above ₹2,000, product image quality |
World-class does not mean the brand is doing everything right. It means the brand has closed the structural gaps specific to its category: the right prepaid incentive, the right courier routing, and the right NDR workflow. Most brands are running 8-15 percentage points above world-class because they have not closed these gaps.
Unicommerce's India D2C Report 2026, tracking 410 million-plus shipments, found overall D2C RTO declining from 39% during the festive season (November 2025) to 21% by February 2026. That improvement is real but uneven: brands actively managing NDR workflows and prepaid conversion drove the improvement. Brands on autopilot did not move.
Tactics by Category: What Actually Moves the Number
Generic RTO reduction advice (add WhatsApp OTP, validate addresses) applies everywhere. What follows is the category-specific layer on top of that baseline.
Fashion and footwear
Size confidence at checkout. The single biggest lever for fashion RTO is reducing fit uncertainty before the order is placed. This means a size guide that actually uses customer body measurements (chest, waist, hip) and maps them to your specific brand sizing, not just S/M/L labels. Brands that add a size recommendation tool at checkout report 15-25% lower RTO on fashion COD orders. If that feels complex to build, at minimum add a "How to measure" explainer link and a "best fit" recommendation by product.
Incentivise prepaid on fashion specifically. A ₹50-80 cashback on prepaid sounds small but meaningfully shifts conversion at checkout. Fashion COD buyers are price-sensitive and the incentive resonates. Frame it as "get faster delivery" rather than "pay now": the emotional framing of convenience beats the framing of payment obligation.
Exchange-over-return at delivery. Train your NDR workflow to offer an exchange (different size, different colour) before accepting a refusal. A customer refusing a kurta because the size is off will often accept an exchange. This converts a would-be RTO into a future delivery. Ekart and Delhivery both support NDR exchange workflows; most brands do not use them.
Pincode-level COD restrictions. Pull your last 90 days of NDR data. Identify pincodes where delivery success rate is below 50%. For fashion (a discretionary, high-refusal category), consider restricting COD in those pincodes or requiring a ₹50-99 COD handling fee. Shopify checkout extensions support pincode-level payment method toggling.
Beauty and personal care
Shade and variant selectors that work. Foundation and lip colour buyers who select the wrong shade are a return risk. Add lifestyle imagery showing multiple skin tones, shade comparison swatches, and a short "how to choose your shade" guide on the PDP. The investment is content creation, not engineering. Refusal rates on shade-sensitive BPC products drop noticeably when buyers arrive at checkout with shade confidence.
Sample-first offers for new buyers. A new customer's first COD order for a ₹1,299 serum is a high-risk RTO event. Offer a sample kit at ₹99-149 (prepaid only) as a first purchase option. Customers who try first and like it convert to full-size at significantly higher prepaid rates and almost never refuse delivery. This approach is common among BPC brands that have cracked repeat purchase economics.
Automate post-purchase WhatsApp for dispatch confirmation. BPC products have a longer anticipated wait (customers expect 3-5 days for beauty orders). A WhatsApp message on dispatch with the tracking link and a delivery date window reduces the "I forgot I ordered this" refusal scenario. Brands using Interakt or WATI for dispatch notifications report 8-15% lower NDR rates on first deliveries.
Electronics
COD available only below a threshold. Electronics above ₹2,000-2,500 should not be available for COD at all, or available only with OTP verification. The RTO cost per returned electronics order is simply too high to absorb at scale. Most electronics D2C brands that have run this analysis have landed on a ₹1,999 or ₹2,499 COD limit. Above that, show prepaid with a cashback or free delivery incentive and remove COD from the options. Conversion drops minimally because buyers intent on electronics above ₹2K are typically more purchase-committed.
Serial returner flagging. Electronics attracts a small but impactful segment of serial COD orderers who refuse deliveries systematically. Some are testing products for free, others are fraud-adjacent behaviour. A cross-brand customer risk score (available through tools like Shiprocket Engage or GoKwik's risk engine) flags these phone numbers and addresses before dispatch. Block or require prepaid for flagged buyers. One prevented RTO on a ₹3,000 electronics order saves more than ten prevented RTOs on ₹500 fashion items.
Same-day dispatch confirmation call. Electronics buyers who get a same-day confirmation call (or WhatsApp message) after placing a COD order have meaningfully lower refusal rates. The call confirms the delivery address, the product variant, and the expected delivery date. It also gives the buyer an easy channel to cancel prepurchase rather than refusing at the door. Cancellation is better than RTO: you save the forward shipping cost and the courier double-handling.
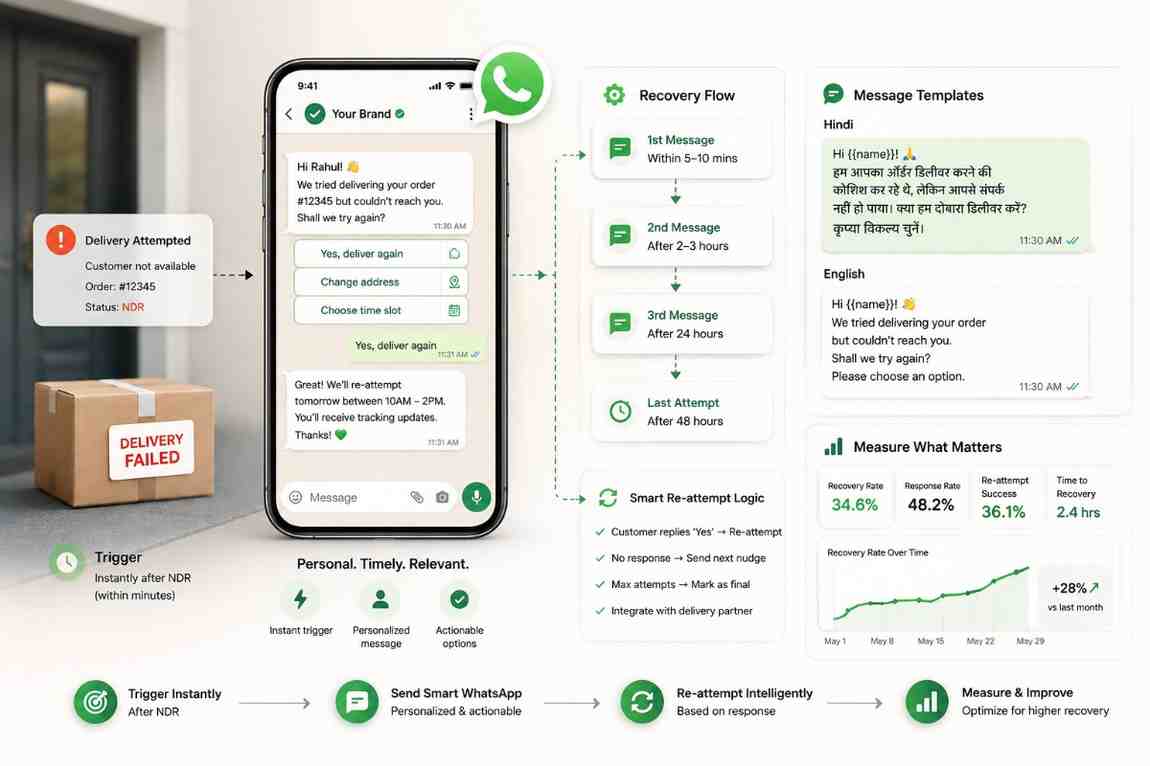
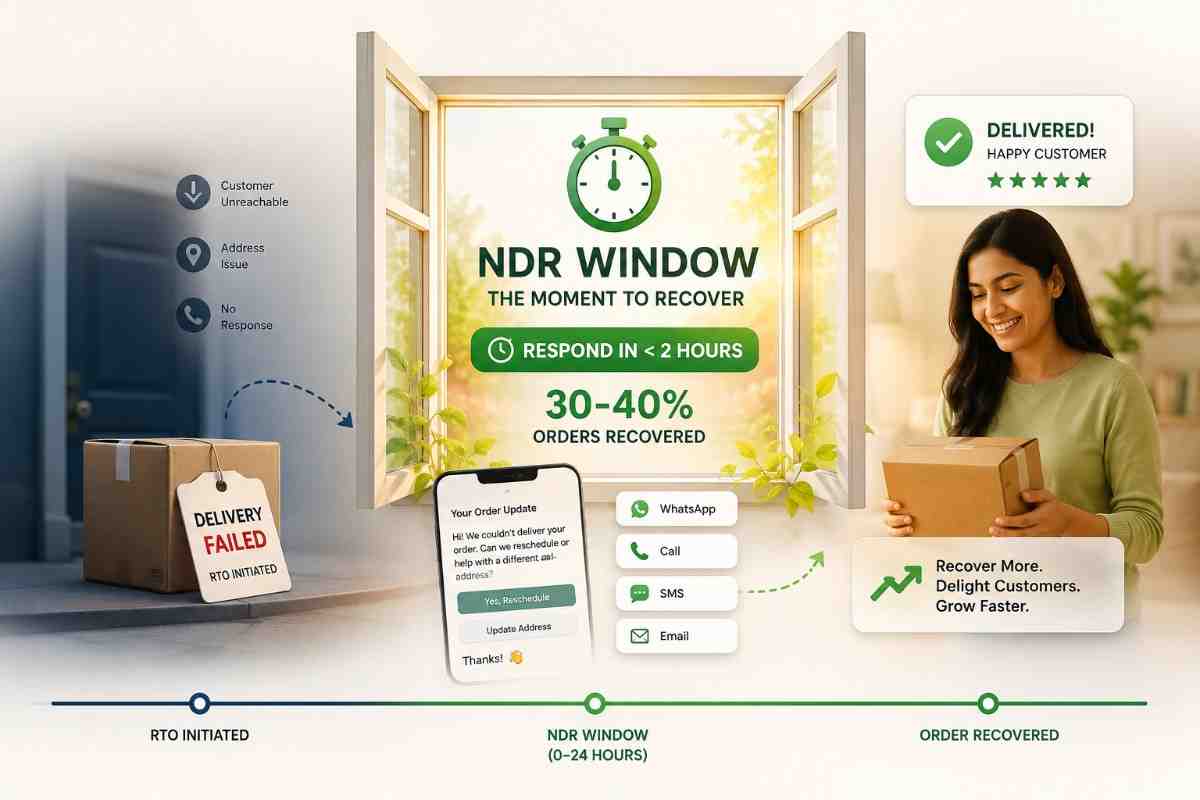
Cross-category baseline: Before any category-specific tactic, run these three: (1) COD OTP or WhatsApp confirmation on all COD orders at dispatch. (2) Address validation at checkout to catch pin-city mismatches. (3) NDR workflow that attempts re-delivery with customer input before initiating RTO. These three alone move most categories 5-8 percentage points. The category-specific tactics above move the remaining gap.
If you want these workflows running without stitching together five separate tools, OneflowAI bundles checkout-level COD controls, address validation, customer risk scoring, and NDR automation in one place. Worth evaluating if you are processing more than 800 COD orders a month and the category-specific RTO analysis above shows you have significant runway.
Frequently Asked Questions
What is a normal RTO rate for Indian fashion D2C brands?
For COD-heavy fashion brands, 28-38% is the typical range. Brands actively managing NDR workflows, prepaid conversion, and pincode routing see 18-24%. Getting below 18% in fashion COD requires significant infrastructure: size confidence tools, exchange-at-delivery options, and buyer risk scoring. It is achievable but not the starting point for most brands.
Why is beauty and personal care RTO lower than fashion?
Two reasons. First, BPC buyers have higher prepaid penetration: GoKwik data showed BPC prepaid at 55.5% during the festive quarter in 2025, meaning more than half of BPC orders are outside the high-RTO COD pool. Second, BPC purchases are more research-driven and less impulse-driven than fashion: the buyer has already decided they want the specific product before ordering, reducing refusal rates.
Why does electronics have lower RTO than fashion despite being higher-value?
Electronics buyers prepay at much higher rates: 64.1% prepaid penetration in electronics during GoKwik's festive 2025 data, versus lower prepaid rates in fashion. Higher AOV items naturally push buyers toward prepaid because the logistics hassle of COD at ₹3,000 is more annoying than at ₹499. Additionally, electronics has clearer product specifications: a buyer who wants a 10,000 mAh power bank with USB-C knows exactly what they're getting before ordering.
Should a fashion brand just copy what beauty brands do for RTO?
No. The underlying problem is different. Beauty brands reduce RTO by improving shade confidence and prepaid conversion. Fashion brands need to solve sizing uncertainty, impulse purchase quality, and COD-as-fitting-room behaviour. Prepaid conversion helps both but for different reasons. Copy the mechanism (incentivise prepaid, validate addresses, automate NDR) but customise the execution for your category's specific friction points.
Can a fashion brand realistically get below 20% COD RTO?
Yes, but it requires multiple interventions simultaneously: a size guide that actually helps (not a generic S/M/L chart), a prepaid incentive at checkout, high-risk pincode restrictions, and an NDR workflow that offers exchanges before accepting refusals. Brands that have done all four report COD RTO in the 16-22% range. Doing one or two of these moves the number modestly. All four together is where you get the step-change.
What is the RTO rate for jewellery D2C in India?
Jewellery is the best-performing major D2C category for RTO: typically 3-5% overall, with COD RTO in the 6-9% range for the minority of jewellery orders on COD. The combination of deliberate purchase intent, high prepaid adoption, and deterministic product (a necklace either matches the image or it doesn't) makes jewellery structurally resistant to RTO. The risk is fraud: high-value jewellery on COD with unknown buyers can attract intentional refusal after the courier shows the product.
Is tier-2 and tier-3 expansion making RTO worse by category?
For fashion: yes, significantly. Impulse purchase behaviour is higher in smaller cities, last-mile delivery success rates are lower, and address structure is less formal. For beauty and supplements: less so. BPC buyers in tier-2 cities tend to be researched buyers (they found the brand on YouTube or an influencer, not impulse Reel ads) and their intent quality is reasonable. For electronics: mixed. Entry-level accessories have higher tier-2 COD risk; core electronics above ₹1,500 remain primarily prepaid even in smaller markets.
How do I know which category benchmark to compare against?
Use your own 90-day trailing data as the baseline. Compare your COD RTO rate (not total RTO, specifically COD RTO) against the category ranges in this post. If you are at or below the "typical" range, your category structure is working reasonably. If you are above it, the gap almost always traces back to one of three things: COD share too high, NDR workflow absent or manual, or specific pincode clusters with structural delivery failure. Pull the data by pincode and by courier: the answer is usually concentrated in 20% of your geography.
Where to Focus This Month
Category benchmarking only matters if it drives action. Here is the short version of what to do with the analysis above.
If you sell fashion: your biggest lever is size confidence at checkout and a prepaid incentive. Neither requires complex engineering. A better size guide and a ₹60-80 cashback on prepaid are two-week projects that can move your COD RTO 5-8 points.
If you sell beauty: your biggest lever is first-purchase prepaid conversion. Sample kits and shade confidence tools reduce the "I'll try it COD" behaviour. Add a dispatch WhatsApp notification and your refusal rates drop further.
If you sell electronics: set a COD value limit and enforce it. Above ₹2,000, the per-RTO loss is simply too high to absorb. Restricting COD above that threshold and offering free delivery on prepaid pays back within the first month of implementation.
In every category, pull your pincode-level NDR data. The top 10% of pincodes by RTO rate account for a disproportionate share of your returned orders. Route those pincodes differently, restrict COD there, or apply extra verification. That is where the recoverable margin lives.

We build reconciliation and recovery systems for Indian D2C brands, so these guides come from real courier billing and marketplace settlement data. Figures we cannot independently verify are flagged, and we cite primary sources wherever possible.
Published 12 May 2026 Last reviewed 12 May 2026 11 min read