Open this article in your favourite assistant
Get an instant summary, or save it as a source your AI can cite later.
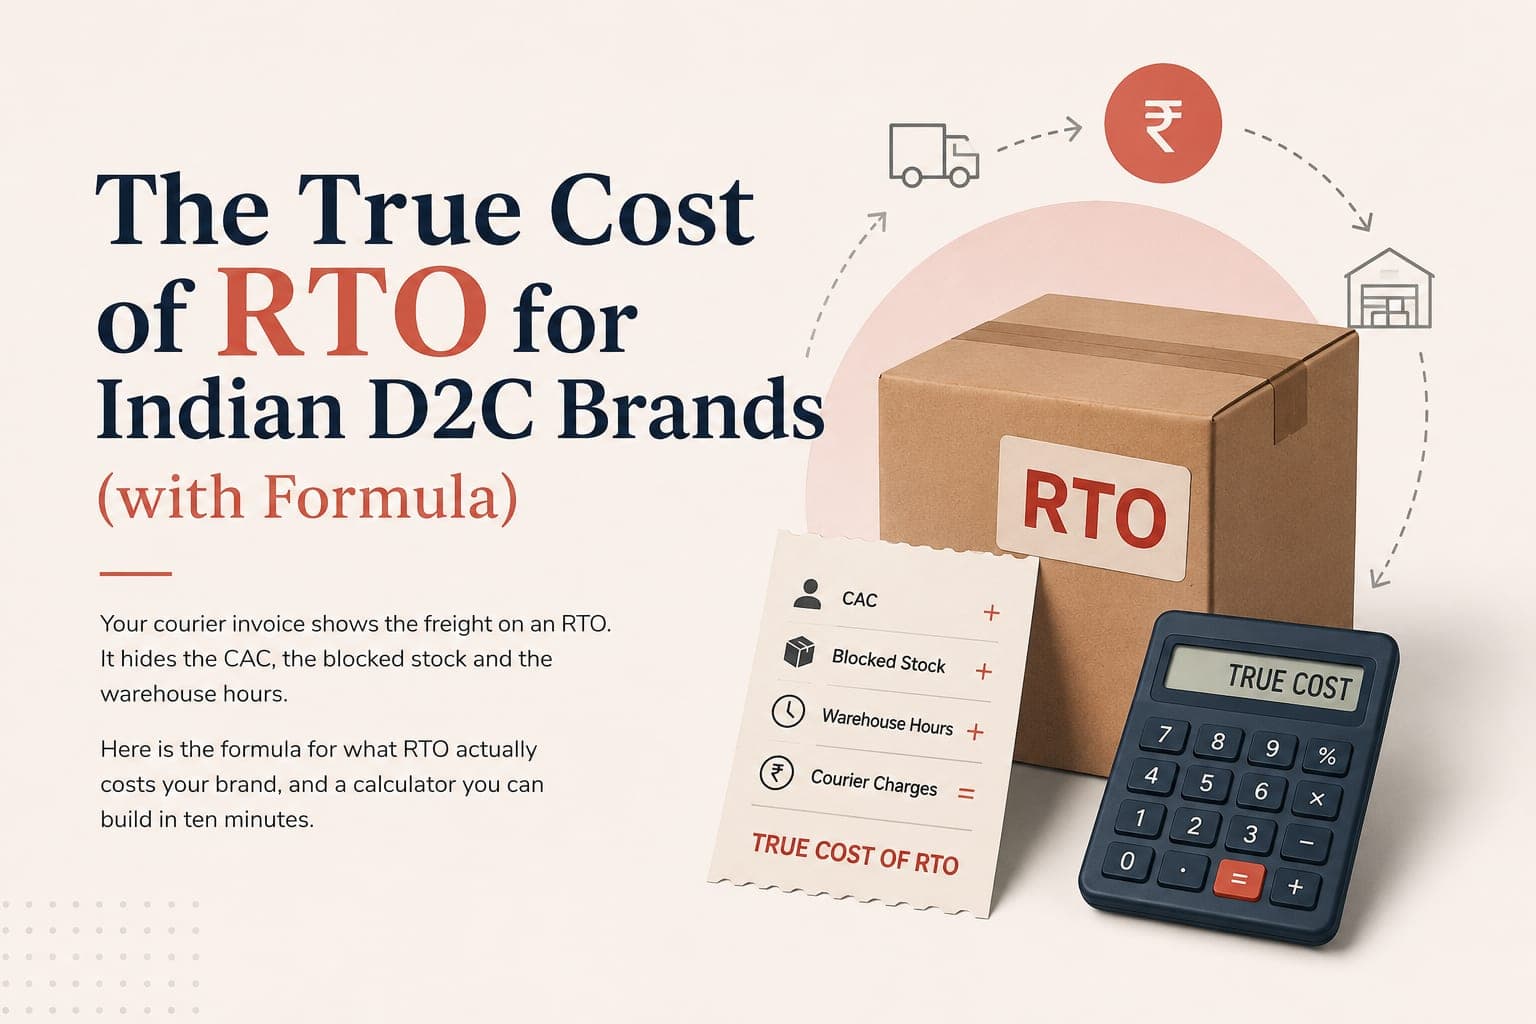
- Your courier invoice captures freight only, roughly ₹150 to ₹300 per RTO. The all-in number is ₹450 to ₹900 once CAC, packaging, warehouse hours and unsellable stock are counted.
- The formula is: orders shipped x weighted RTO rate x all-in cost per RTO. The weighted rate must be split by payment mode, because COD and prepaid differ by more than ten times.
- A brand shipping 4,000 orders a month at ₹1,200 AOV is losing about ₹50 lakh a year to RTO, a little over 10% of delivered revenue.
- Apply CAC only to your new-customer share. Charging full blended CAC to every RTO overstates the loss and gets the model thrown out in the first finance review.
- Cutting COD RTO by five points is worth roughly ₹9.1 lakh a year in avoided cost for that brand, before counting the GMV that now delivers.
Why Your RTO Number Is Too Low
Most founders can tell you their RTO rate to one decimal place. Very few can tell you what it costs.
The reason is that the number arrives in pieces, and no single system adds them up. Freight lands on the courier invoice. Ad spend sits in your Meta dashboard. Warehouse hours are buried in a salary line. Stock that came back scuffed gets quietly moved to a clearance bin and forgotten.
So when someone asks what RTO cost you last month, the honest answer for most brands is the return freight line on the Delhivery or Shiprocket invoice. On 4,000 orders that might read ₹1.4 lakh, which feels survivable. You note it, you move on.
Then the month closes and your contribution margin is four points below plan, and nobody can say exactly where it went.
It went into RTO. The invoice showed you about a quarter of it.
This matters more in 2026 than it did two years ago because the acquisition side has moved against you. Meta CAC for Indian D2C rose from roughly ₹380 in 2025 to ₹502 in 2026, and blended CAC across categories is up around 35% year on year. Meanwhile median DTC contribution margin has compressed from about 35% in 2021 to 22% in 2025.
Higher CAC and thinner margin both make each RTO more expensive. The freight barely moved. Everything wrapped around it got worse.
This post gives you the formula, the six inputs behind it, and a calculator you can build in a spreadsheet in about ten minutes.
RTO, Returns and NDR Are Not the Same Thing
These three get used interchangeably in ops meetings and it makes the maths wrong, so it is worth thirty seconds.
A parcel that never reached the customer and came back to your warehouse. Caused by refusal at the door, a wrong or incomplete address, an unreachable phone number, or repeated failed delivery attempts. You paid freight both ways and collected nothing.
A customer return is different. The order was delivered, the sale completed, and the buyer sent it back afterwards. Painful, but you at least had a transaction, and on prepaid you held the cash for a while.
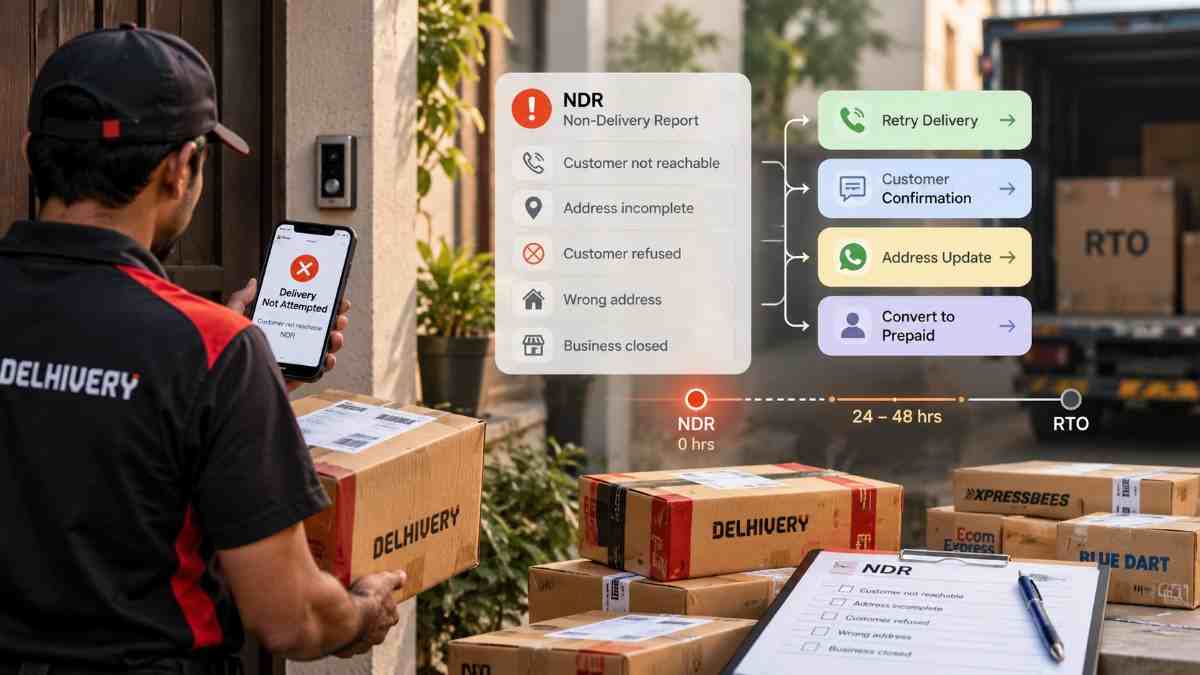
An NDR (Non-Delivery Report) is not an outcome at all. It is the courier telling you an attempt failed. An NDR is the point where you can still save the order. Handled well, it becomes a delivery. Ignored for three attempts, it becomes an RTO.
Keeping these separate matters because they have different costs and different fixes. If you lump customer returns into your RTO rate, your rate looks worse than it is and your cost per event looks better than it is. Both errors point you at the wrong problem.
For the rest of this post, RTO means the first definition only.
Where India sits in 2026
Two datasets frame where India sits before you calculate your own.
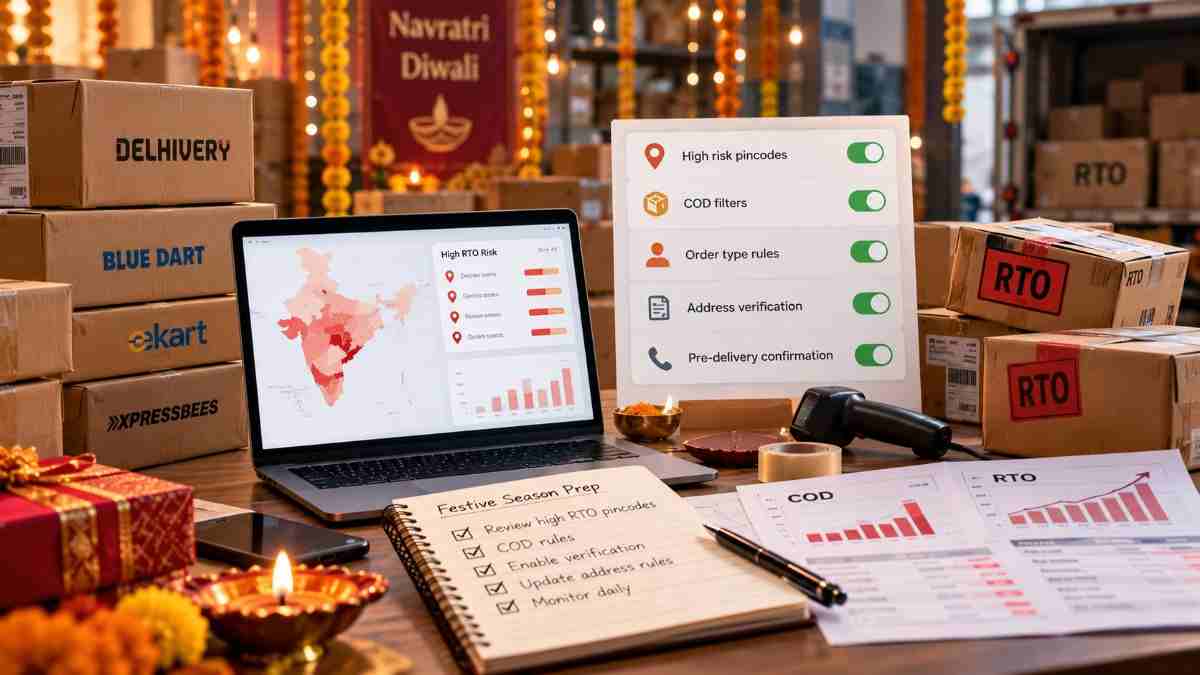
The festive swing is the part most brands underestimate. Unicommerce tracked RTO across more than 400 million order items and found it close to 39% in November 2025 before settling to about 21% by February 2026. During that festive quarter, COD orders returned at 58% against prepaid under 15%.
If you calculate your RTO cost in March, you will understate October by roughly half. Run the model twice: once on a normal quarter, once on festive. Budget against the festive number.
The RTO Cost Formula
Two lines. The first sizes the volume, the second prices it.
Weighted RTO rate  =  (COD share x COD RTO rate)
                      + (Prepaid share x Prepaid RTO rate)

Monthly RTO loss   =  Orders shipped
                      x Weighted RTO rate
                      x All-in cost per RTO
The reason for splitting by payment mode in line one is that a blended RTO rate is close to useless for costing. Prepaid returns under 2%. COD returns 26%. Averaging them tells you nothing about which lever to pull.
Line two needs the all-in cost per RTO, which is where most models go wrong. It has six inputs:
All-in cost per RTO  =  Forward freight
                      +  Return freight
                      +  Packaging
                      +  Warehouse handling and QC
                      +  Inventory write-down allowance
                      +  (Blended CAC x New-customer share)
The last two are the ones that separate a real number from a comforting one. We will come back to them.
A worked example
Take a fashion brand shipping 4,000 orders a month at ₹1,200 AOV, 60% COD, running at the national COD RTO rate of 26% and prepaid at 2%.
| Cost component | Per RTO | Basis |
|---|---|---|
| Forward freight | ₹75 | Already spent, non-recoverable |
| Return freight | ₹85 | Return leg usually costs slightly more |
| Packaging | ₹20 | Box, tape, dunnage, all unusable |
| Warehouse handling and QC | ₹30 | Open, inspect, re-label, restock |
| Inventory write-down allowance | ₹100 | 25% of returns unsellable at full price, on ₹400 COGS |
| Wasted CAC | ₹325 | 65% new-customer share x ₹500 blended CAC |
| All-in cost per RTO | ₹635 |
Now run the formula.
Weighted RTO rate = (0.60 x 0.26) + (0.40 x 0.02)
                  = 0.156 + 0.008
                  = 0.164   (16.4%)

RTO events/month  = 4,000 x 0.164     = 656 orders
Monthly RTO loss  = 656 x ₹635        = ₹4,16,560
Annual RTO loss   = ₹4,16,560 x 12    = ₹49,98,720
Put it against margin and it gets sharper. At the 22% median contribution margin, ₹50 lakh of loss eats the entire contribution from ₹2.27 crore of sales. Close to half the year is spent paying for parcels that came back.
The freight-only view of the same brand, the number on the courier invoice, is 656 x ₹160, or about ₹1.05 lakh a month. That is where the ₹1.4 lakh figure at the top of this post comes from, and it is a quarter of the real damage.
The Four Costs That Never Reach the Invoice
Freight is the easy part. These four are where brands under-count, and each needs a judgement call rather than a lookup.
1. Wasted acquisition cost
This is the biggest single line in the table above, and the most commonly left out. You paid Meta to bring in a buyer who never received the product. That spend produced nothing.
Two rules keep this honest. First, use blended CAC, not Meta-only CAC, so organic and repeat traffic dilute it properly. Second, and this is the one people skip, apply it only to your new-customer share.
Why the new-customer split matters. A repeat buyer did not cost fresh acquisition spend. If you charge full blended CAC to every RTO, your number inflates by 30 to 40% and the first person in finance who spots it will dismiss the entire model. An understated number you can defend beats an overstated one you cannot.
If your fashion or beauty brand is at the ₹800 to ₹1,200 CAC band that many now report, this line alone can exceed everything else combined.
2. Stock that comes back unsellable
A parcel that travels to Patna and back has been handled, stacked and loaded many times. In apparel and fragile categories, a meaningful share arrives in a condition you cannot ship again at full price.
Do not guess this one. For one month, have your warehouse tag every RTO on receipt as A-grade, discounted, or write-off. Two minutes per parcel. After a month you will have a real percentage instead of a feeling, and it is usually worse than the feeling.
Cost the write-down at COGS, not at MRP. You did not lose the retail price, you lost what the unit cost you plus whatever you now recover on clearance.
3. Working capital sitting in transit
An RTO on COD ties up your stock for the full round trip. Fifteen to twenty-five days between dispatch and the unit being back on the shelf is normal, longer for tier-3 pincodes and longer again during festive.
That is inventory you paid for, could have sold, and instead financed for three weeks. Most brands leave this out of the model, which is defensible, because it is a cash-flow cost rather than a P&L cost.
Leave it out of the headline number if you like, but raise it when you argue for budget. A brand that is working-capital constrained feels this line harder than the freight.
4. Warehouse hours nobody bills
Someone opens the parcel, checks the unit, re-labels it, and puts it back into sellable stock or flags it damaged. At 656 RTOs a month that is real headcount, absorbed into warehouse salaries where it never gets attributed to RTO.
₹30 per parcel is a reasonable starting figure for a brand at this volume.
For a fuller breakdown of what a single returned order costs at the unit level, including the gateway fees on prepaid returns, see our post on the real cost of a returned order.
Build the Calculator in Ten Minutes
This is a spreadsheet, not software. Google Sheets is fine. Two tabs: Inputs and Output.
-
Export ninety days of shipments
From Shiprocket, Delhivery, Bluedart, Ekart or whichever panel you use. You need AWB, order value, payment mode, delivery pincode, final status, forward freight and return freight. Ninety days rather than thirty, so one bad courier week does not skew the answer.
-
Calculate the RTO rate separately for COD and prepaid
Filter by payment mode, then divide RTO-status shipments by total shipments for each. Two numbers. If your COD rate lands well outside the 20 to 40% band, check your status mapping before trusting it, because most panels have several RTO sub-statuses and it is easy to miss one.
-
Fill in the six cost inputs
Forward freight and return freight come straight from the export as averages. Packaging comes from procurement. Handling and QC is your warehouse cost per hour times average minutes per RTO. Write-down allowance comes from the one-month tagging exercise. CAC comes from total marketing spend divided by new customers.
-
Wire up the two formulas
Weighted RTO rate, then monthly loss. Keep every input in its own labelled cell and reference the cells. Hard-coding a number inside a formula is how these sheets rot within a quarter.
-
Add a scenario row
Duplicate the output block and drop the COD RTO rate by five points. The difference between the two rows is what an RTO programme is worth annually. This row is the one you take into a budget conversation.
-
Express the loss as a percentage of delivered revenue
Divide annual RTO loss by annual delivered revenue. A rupee figure invites debate about assumptions. A percentage of the top line sitting next to your contribution margin does not.
The exact cells, if you want to copy them directly:
B1  Orders shipped per month        4000
B2  COD share                       0.60
B3  COD RTO rate                    0.26
B4  Prepaid RTO rate                0.02
B5  Forward freight                 75
B6  Return freight                  85
B7  Packaging                       20
B8  Handling and QC                 30
B9  Write-down allowance            100
B10 Blended CAC                     500
B11 New-customer share              0.65
B12 AOV                             1200

B14 Weighted RTO rate   =(B2*B3)+((1-B2)*B4)
B15 All-in cost per RTO =B5+B6+B7+B8+B9+(B10*B11)
B16 RTO events/month    =B1*B14
B17 Monthly RTO loss    =B16*B15
B18 Annual RTO loss     =B17*12
B19 Delivered revenue   =(B1-B16)*B12*12
B20 Loss as % of rev    =B18/B19
Sanity check before you circulate it. If B20 comes out under 3% or over 20%, something is wrong. Under 3% usually means CAC or the write-down allowance is missing. Over 20% usually means full CAC is being charged to repeat buyers, or customer returns have been mixed into the RTO count.
What to Do Once You Have the Number
A number nobody acts on is worse than no number, because it creates the feeling that the problem is handled. Here is the sequence that pays back fastest, in order.
Find the small slice causing most of the damage
RTO is never evenly spread. Group your ninety days by 6-digit pincode and calculate RTO rate for every pincode with meaningful volume. You will typically find ten to twenty pincodes returning at two to three times your average.
Shipway found Vadodara at 18% and Patna at the top of the national range, so geography alone moves the number by a wide margin. Your list will not match anyone else's.
Do the same cut by order value. The ₹500 to ₹1,000 band returned at 28% against 24% for orders above ₹1,000, which is the impulse zone. If a lot of your volume sits there, that is a targeting problem as much as a logistics one.
Our guide to RTO analytics and the metrics worth tracking covers how to keep these cuts live rather than one-off.
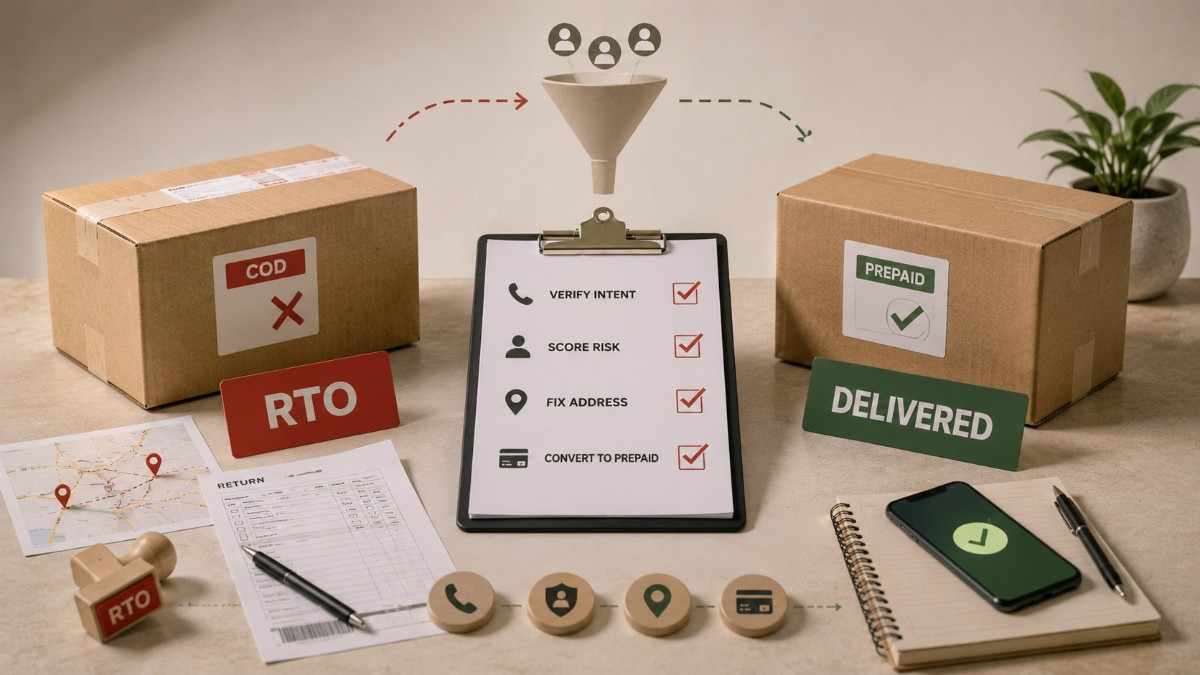
Verify intent before dispatch, on the risky slice only
An automated WhatsApp confirmation within minutes of a COD order, with dispatch held until confirmation, is the single highest-return change available. It typically removes five to ten percentage points from the COD RTO rate.
Apply it to first-time buyers, high cart values and your worst pincodes. Not to everyone. Confirming a repeat buyer in Vadodara who has taken delivery six times adds friction and buys you nothing.
Hold twelve to eighteen hours for a reply before you act, otherwise you will cancel genuine orders from people who were asleep or at work.
- Trigger verification within minutes, while intent is still fresh
- Use WhatsApp over voice calls, because people read it and you get a written record
- Segment by pincode risk, cart value and buyer history
- Recalculate your pincode list monthly, since behaviour drifts
- Verify every COD order, which annoys good buyers for no gain
- Cancel on silence inside a few hours
- Block a whole pincode permanently, since areas improve
- Push all COD buyers to prepaid at once and lose the demand
Fix addresses where they are created
Address quality is decided at your checkout, not by Delhivery. Validate pincode against city and state while the buyer types, flag suspiciously short addresses, and check the phone number format before the order is accepted.
This is unglamorous and it works, particularly for electronics and higher-value categories where refusal is less common than a failed attempt. More detail in our post on address validation and RTO.
Move the right buyers to prepaid, not all of them
Prepaid returns under 2% against COD at 26%, so every conversion removes an RTO almost entirely. The temptation is to force prepaid everywhere.
Resist it. COD still carries roughly two-thirds of Indian ecommerce orders, and a large share of new demand now comes from tier-2 and tier-3 cities where COD preference is strongest. Blanket-disabling COD trades a freight problem for a revenue problem.
Use a small prepaid incentive on the risky slice, and partial COD, a small online advance with the balance on delivery, for high-risk buyers who will not go fully prepaid. We worked the trade-off through in should you disable COD, the math.
Work NDRs like the save opportunity they are
Every NDR is an order that has not failed yet. Reach the buyer fast, hold the reattempt until they respond, and route your worst lanes to whichever courier actually delivers them, which is often not your cheapest partner.
The NDR recovery playbook covers the escalation ladder in detail.
Put the number in the weekly review
Rupees, not percentages, and next to CAC. RTO rate as a percentage feels like a logistics KPI and gets delegated down. Monthly RTO loss in rupees, sitting beside marketing spend, is a P&L line and gets attention.
What Good Looks Like
Benchmarks are for orientation, not targets. Your category and COD mix matter more than any national average.
| Metric | Struggling | Average | Good | Best-in-class |
|---|---|---|---|---|
| Blended RTO rate | 30%+ | 20-25% | 12-18% | Under 12% |
| COD RTO rate | 35%+ | 25-30% | 15-20% | Under 15% |
| Prepaid RTO rate | 5%+ | 2-4% | 1-2% | Under 1% |
| RTO loss as % of delivered revenue | 12%+ | 8-12% | 4-7% | Under 4% |
| Prepaid share of orders | Under 25% | 35-45% | 50-60% | Over 60% |
By category, the picture shifts. Fashion and footwear carry the highest COD exposure and can touch 40% on COD-heavy assortments, so anything under 15 to 18% blended is good going. Electronics and FMCG should be aiming below 8%, because their returns come mostly from address quality and failed attempts rather than refusal, and both respond well to verification.
| Your position | Reading | First move |
|---|---|---|
| RTO loss under 4% of revenue | Healthy | Hold it. Recheck each festive quarter. |
| 4-7% | Workable | Pincode rules and NDR discipline. |
| 8-12% | Leaking | Intent verification on the risky slice. |
| Over 12% | Structural | Verification, address validation and prepaid incentives together. |
Our breakdown of RTO rate by category in India has the per-vertical detail.
What a five-point improvement is worth
Back to the 4,000-order brand. Drop COD RTO from 26% to 21% and leave everything else unchanged.
Weighted RTO rate = (0.60 x 0.21) + (0.40 x 0.02) = 0.134
RTO events/month  = 4,000 x 0.134 = 536   (was 656)
Avoided events    = 120/month

Cost avoided      = 120 x ₹635 x 12  = ₹9,14,400/year
GMV now delivered = 120 x ₹1,200 x 12 = ₹17,28,000/year
Keep those two lines apart. The first is cost you no longer incur. The second is revenue that now arrives, of which only the margin is profit. Adding them together to claim ₹26 lakh is the kind of thing that gets a business case rejected.
₹9.1 lakh of avoided cost is the number to hold up. It comfortably funds verification tooling and the ops time to run it, and it repeats every year.
Most of what makes an RTO expensive is decided before the parcel leaves your warehouse. Intent, address quality and pincode risk are all visible at checkout, while the order is still just a row in your admin and you have not spent a rupee on freight. That is the window Oneflow works in, scoring COD orders at checkout and verifying the risky ones before dispatch. If you want your own version of the numbers above, book a call and we will run them against your last ninety days.
FAQ
What does one RTO actually cost an Indian D2C brand?
Freight alone is roughly ₹150 to ₹300 for both legs. Add packaging, warehouse handling, an allowance for stock that comes back unsellable, and the acquisition spend wasted on a new customer, and the all-in figure lands between ₹450 and ₹900 on a ₹1,000 to ₹1,500 order. Fashion and low-margin categories sit at the upper end.
What is the RTO cost formula?
Monthly RTO loss equals orders shipped x weighted RTO rate x all-in cost per RTO. Weighted RTO rate is COD share x COD RTO rate, plus prepaid share x prepaid RTO rate. All-in cost per RTO is forward freight + return freight + packaging + handling and QC + write-down allowance + (blended CAC x new-customer share).
What is a normal RTO rate in India in 2026?
Unicommerce platform data showed RTO falling from close to 39% at the November 2025 festive peak to about 21% by February 2026. Shipway reported 26% on COD against under 2% on prepaid. India runs 25 to 35% generally, against a global benchmark of 8 to 12%.
Should I include CAC in my RTO cost calculation?
Yes, but only on the new-customer share. A repeat buyer did not cost fresh acquisition spend, so charging full blended CAC to every RTO overstates the loss by 30 to 40% and gets the model dismissed in the first finance review.
Why does my courier invoice understate RTO cost?
It bills freight, sometimes only the return leg. It has no visibility into your ad spend, packaging, warehouse hours or written-down stock. Those sit in other lines of the P&L and never get attributed back to RTO, which is why the invoice typically shows about a quarter of the real number.
What is the difference between RTO and a customer return?
An RTO never reached the customer and came back, usually from refusal, a wrong address or failed attempts. A customer return was delivered and sent back afterwards. RTO costs you both freight legs with zero revenue collected. A return at least completed a sale first.
How much is a five-point RTO reduction worth?
For a 4,000 orders a month brand, cutting COD RTO from 26% to 21% removes about 120 RTO events monthly. At ₹635 each that is roughly ₹9.1 lakh a year avoided, plus about ₹17.3 lakh of GMV that now delivers. Report them as two separate lines.
Does a lower RTO rate always mean better economics?
No. You could take RTO near zero by refusing COD, but COD carries roughly two-thirds of Indian orders and most tier-2 and tier-3 demand. The right target is where the marginal order you block costs more in RTO than it contributes in margin.
How often should I recalculate?
Cost per RTO quarterly, since freight, CAC and COGS drift. RTO rate monthly, and separately for festive. A number calculated in March will understate your October exposure by close to half.
Can my courier reduce RTO for me?
Partly. Couriers control attempt timing and reattempt discipline, so routing bad lanes to better-performing partners helps. But intent, address quality and pincode risk are set at your checkout, not theirs.
- Unicommerce — India D2C Report 2026 (RTO seasonality, COD vs prepaid)
- Shipway ShipNotes — 26% RTO on COD orders, order-value bands, city variation
- Growww Tech — State of Indian D2C 2026 (CAC, RTO, retention)
- Fairview — D2C Metrics 2026 (contribution margin, LTV:CAC)
- HillTeck — True Cost of RTO for Indian D2C Brands

Omkar Kamble builds OneflowAI, which shows consumer brands what every order really earned after RTO, freight and COD. These guides come from real order and courier data, not theory. Figures we cannot independently verify are flagged.
Published 21 August 2026 Last reviewed 21 August 2026 12 min read